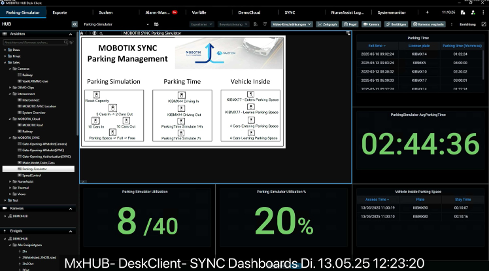
MOBOTIX Sync Dashboard is a Plug IN by MOBOTIX which is made for MOBOTIX HUB. For this purpose, the MOBOTIX Plug In will be extended by additional layout grid elements. Similar to the Thermal Dashboard, it will be possible to create a layout from different elements.
With the new Plug IN, the user will be able to display the following elements in the grid:
- Camera streams (as usual)
- MOBOTIX Sync Grafana elements like:
- Bar graphs, e.g. showing the course of the traffic volume
- Curve diagrams, e.g. showing the increase in traffic flow
- Pie charts showing e.g. the detected car brands
- MOBOTIX Sync lists of detected number plates
Video with most important functions:
MOBOTIX SYNC examples:
Export of Grafana data as CSV:
Layout with status message with which “external” system the connection is established.
Operating options:
- In the playback view, a click on a recognized number in the list (click on date / time) triggers the jump in the player to the corresponding event time
- Double-clicking on an element in Grafana or Cloud will enlarge the element and double-clicking again will minimize the element.
The relevant configuration steps for Sync to integrate the Grafana dashboards in the layout:
In MOBOTIX Sync in the Dashboards section, the individual dashboards can be created.
Important: For adding Graphana chart / Elements in the layout you need to enable the BASIC Authentication in the Sync Configuration file
Each dashboard created will then be available for selection in the Layout Setup of the MOBOTIX HUB Smart Client.
With “Create” - Dashboard and “Add New Panel” a new panel can be created.
In the menu, individual data and form can be determined how the dashboard should appear.
IMPORTANT: The assigned name is displayed as a selection in the drop-down field in the setup of the Layout.
Create MOBOTIX HUB Smart Client layout with Grafana Dashboard:
In the page area, the new element MOBOTIX SYNC is now available for selection as layout element.
After placing the element in the layout, the SYNC instance can be selected (requires that these have been created in the MOBOTIX HUB Management Client beforehand with the general access data such as URL and user account.
Select the corresponding Grafana Dashboard:
MOBOTIX HUB Management Client Setting for SYNC:
Requirements:
- MOBOTIX HUB L2 or higher
- MOBOTIX P7 Camera such as M73 with activated Vaxtor ALPR or Make Model Colour App
- MOBOTIX SYNC Server + Grafana Plug-In
- MOBOTIX Plug IN Version March 2024 or newer
Die MOBOTIX SYNC Funktion wird ab dem MOBOTIX HUB Level 2 und höher unterstützt!
Important: The “Tab” in the Desk Client can also be used without the Grafana plugin. For the display of SYNC Server data in the layout, e.g. lists of number plates or statistical graphics etc., Grafana can be purchased later in the MOBOTIX SYNC Server if required (extra licence).


